
There is a large gap between the ROI that appears in sales presentations and what ends up in your bank account. That gap is not accidental: it is the result of using optimistic assumptions, ignoring real costs and projecting occupancy rates that rarely hold up in the first year.
This article presents real income, operating cost and net return data for vacation rental properties in Florida in 2026. Not developer projections. Numbers based on actual market behavior.
Why presentation numbers do not match reality
Before getting into the data, it is worth understanding why the gap exists.
Sales presentations project 80% or higher occupancy from the first year. In practice, a new property with no review history, no platform positioning and no recurring guest base rarely reaches 70% in the first year. Positioning takes time.
Operating expenses are presented as 30% or 35% of gross income. The reality for professionally managed vacation rentals in Florida is between 45% and 55%, including the property manager commission, cleaning, maintenance, specific STR insurance, property tax, HOA and licenses.
The purchase price is used as the ROI base but does not include closing costs, furniture, equipment or capital reserve. The actual investment is between 10% and 15% higher than the property price.
With those three adjustments, a projected ROI of 8% can become a real 3% or 4%. That is not fraud: it is a difference in assumptions. But it is a difference that matters when you are making a $400,000 or $500,000 investment decision.
Real income data by zone in Florida 2026
| Zone | Property type | Real average occupancy | Average nightly rate | Annual gross income |
| Kissimmee (Storey Lake, Windsor) | 4 bed private pool | 70% – 78% | $175 – $240 | $44,713 – $68,256 |
| Champions Gate | 5 bed private pool | 72% – 82% | $210 – $290 | $55,188 – $86,789 |
| Reunion Resort | 6 bed private pool | 68% – 76% | $280 – $420 | $69,384 – $116,424 |
| Davenport / Four Corners | 4 bed private pool | 65% – 75% | $150 – $210 | $35,588 – $57,488 |
| Cape Coral (canal-front) | 3 bed canal access | 58% – 70% | $180 – $260 | $38,106 – $66,430 |
| Miami Beach / Brickell | 2 bed condo | 62% – 75% | $220 – $380 | $49,790 – $103,950 |
Gross income figures are calculated by multiplying available nights by average occupancy and average nightly rate. Variations within each range depend on property condition, management, photography and platform positioning.
Real operating expense breakdown
This is the table that makes the biggest difference between a projection and reality:
| Expense category | % of gross income | Note |
| Property manager commission | 20% – 30% | Upper range applies to full-service with dynamic pricing |
| Cleaning and supplies | 8% – 12% | Higher for large properties with frequent turnover |
| Maintenance and repairs | 5% – 9% | Higher for properties over 5 years old |
| STR + wind + flood insurance | 6% – 14% | Upper range applies in coastal zones like Cape Coral |
| Property tax | 6% – 10% | Varies by county and assessed value |
| HOA | 4% – 12% | Upper range applies in premium communities like Reunion |
| Licenses and Tourist Development Tax | 1% – 2% | Required to operate legally |
| Platforms and management tools | 1% – 3% | PMS, dynamic pricing, channel manager |
| Total operating expenses | 51% – 72% | Lower range applies without mortgage and with low HOA |
A 51% floor and 72% ceiling. That means in the best scenario, of every $100 that comes in, $49 remains before paying the mortgage. In the worst, $28.
The difference between those extremes is not bad luck: it is a choice of zone, community and management model.
If you want to understand which management model makes most sense for your property, you can review our property management in Orlando analysis.
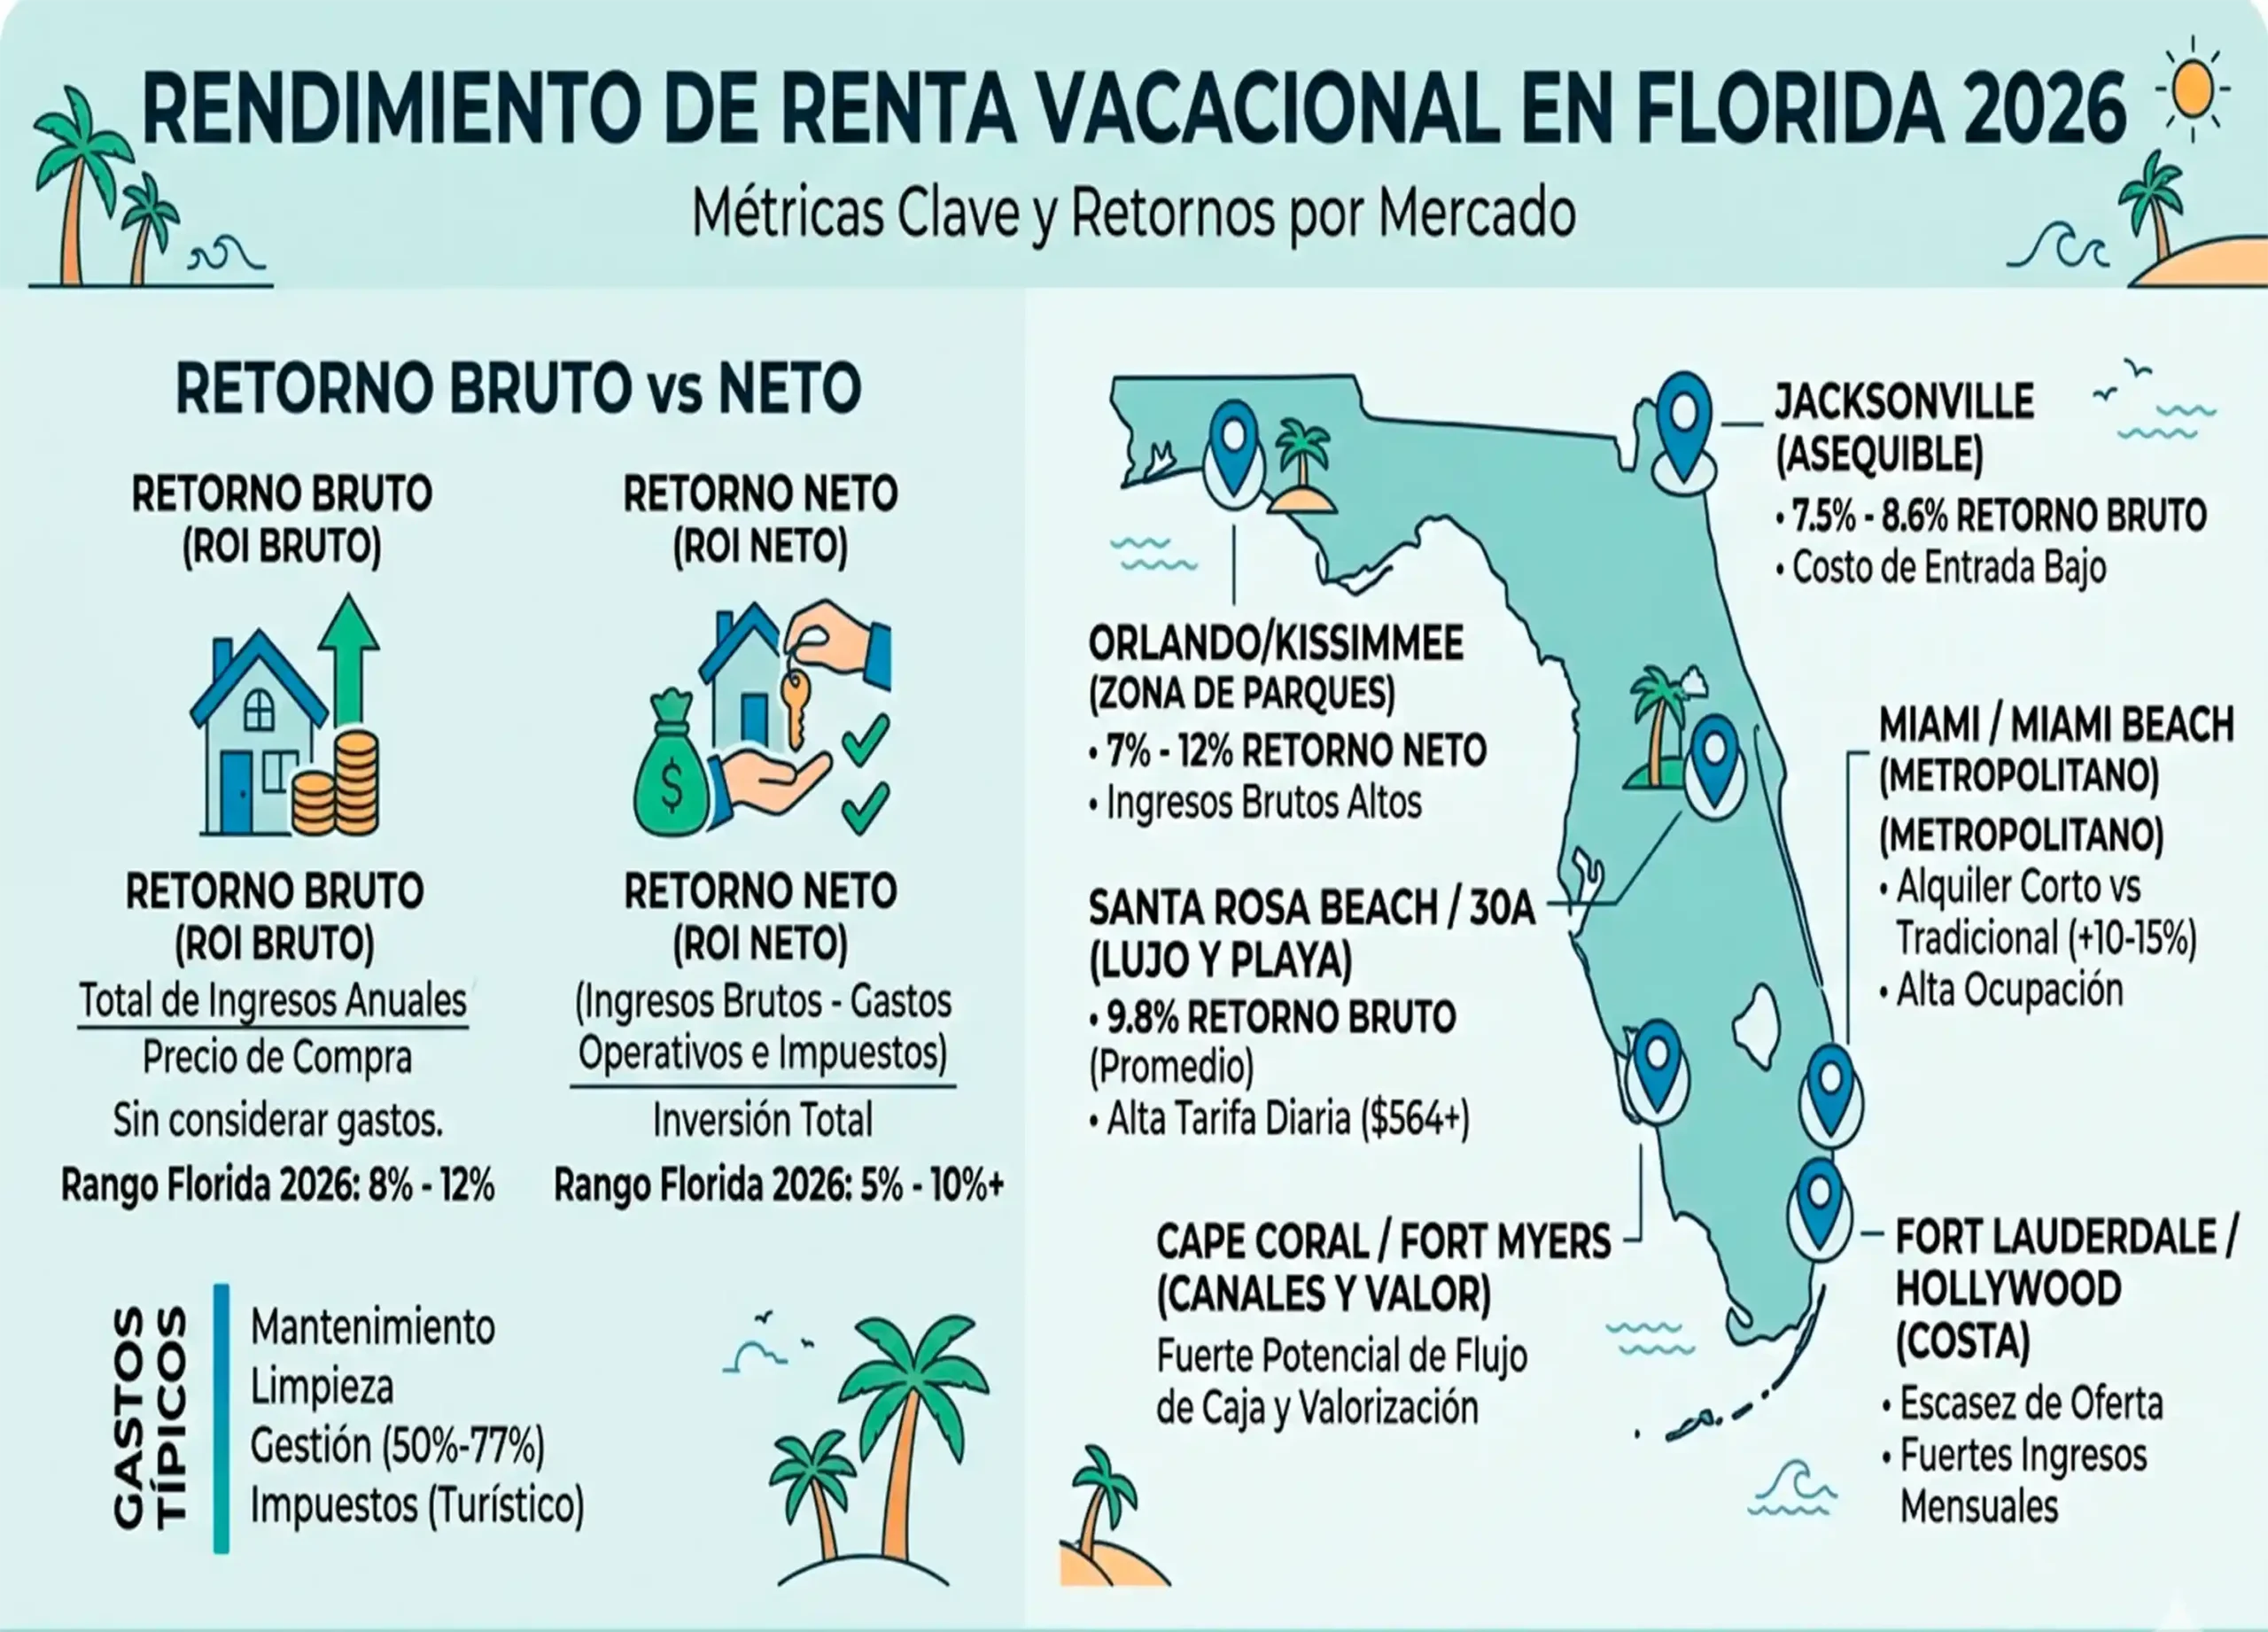
Three real ROI examples from different zones
Example 1: Davenport, 4-bedroom home, cash purchase
- Purchase price: $380,000
- Total investment (includes closing costs + furniture + reserve): $422,000
- Annual gross income: $46,000
- Operating expenses (54%): $24,840
- NOI: $21,160
- Cap rate: 5.57% / ROI: 5.01%
Example 2: Champions Gate, 5-bedroom home, with 30% down
- Purchase price: $550,000
- Down payment + costs + furniture + reserve: $198,000
- Annual gross income: $68,000
- Operating expenses (52%): $35,360
- NOI: $32,640
- Annual debt service (70% at 7.5%): $28,944
- Net cash flow: $3,696
- Cash-on-cash ROI: 1.87%
- Property cap rate: 5.93%
Example 3: Kissimmee 2-bedroom condo, cash purchase
- Purchase price: $185,000
- Total investment: $202,000
- Annual gross income: $28,500
- Operating expenses (62%): $17,670
- High HOA (community with amenities): included in expenses
- NOI: $10,830
- Cap rate: 5.86% / ROI: 5.36%
All three examples show that real cash ROI in Florida’s vacation rental market in 2026 is in the 5% to 6% range for cash purchases, and can drop significantly when financed at current rates.
What determines whether ROI lands at the high or low end of the range
It is not just the zone. It is the combination of four factors:
Purchase price relative to income potential. A property bought at the right price in relation to the income it can generate has a better cap rate than an overpriced one. Negotiating well on the purchase has a direct impact on ROI from day one.
Dynamic pricing management. Properties using dynamic pricing tools generate between 12% and 20% more annual income than those using fixed prices. That difference can be worth $5,000 to $8,000 per year on a mid-size property.
HOA cost. A $600 monthly HOA is $7,200 per year coming out before calculating ROI. Choosing a community with a $250 vs $600 HOA can represent a $4,000 annual difference in net results.
Operational efficiency. Owners who negotiate better rates with cleaning teams, do preventive rather than emergency maintenance and manage reviews well have more efficient cost structures.
For a review of how these factors apply to specific available properties on the market, the Florida HomeGroup Realty team can prepare a personalized projection with real data before you make a decision.
FAQ about vacation rental ROI in Florida
What ROI is realistic to expect in the first year of operation?
The first year is usually the lowest because the property has no review history or platform positioning. A 3% to 4% ROI in the first year is realistic for a well-managed property. From the second year onward, with accumulated reviews and positioning, ROI can climb to 4.5% or 5%.
Does ROI improve if I manage the property myself without a property manager?
In theory yes, because you eliminate the 20% to 30% commission. In practice, most owners who manage from abroad without a well-built system have lower occupancy, more operational problems and worse reviews than those who hire a good manager. The commission savings can be lost in lower income.
How does appreciation affect total investment return?
Total return includes cash flow plus appreciation. In Orlando’s market, historical appreciation has been 3% to 6% annually in tourist zones. A $450,000 property appreciating at 4% gains $18,000 in value in a year. That return is not in the bank account until you sell, but it does form part of the total investment return.
Should I buy in cash or with a mortgage to maximize ROI?
It depends on your objective. Cash maximizes cap rate and avoids negative cash flow risk. With a mortgage you amplify return on personal capital if the property appreciates faster than the cost of debt. At current interest rates, many properties have negative cash flow when financed. That can make sense if appreciation compensates, but it requires capital reserves to sustain the period.
Florida’s 2026 vacation rental market numbers are more moderate than in previous years, but still solid for those who enter with calibrated expectations and do the analysis thoroughly before buying.